
- Home
- Reports Store
- Food Security
Food Security & Food Resilience Market – GCC, Growth, Technology, Competitive Landscape & Forecast 2026–2035
Customise your request
Need this report to answer something it does not cover? Tell us the decision you are facing and we will scope the work — or point you to a study that already answers it.
info@cortexmeridian.com+971 56 483 5090Report Scope
| Report ID / SKU | CM-AG-0009 |
|---|---|
| Report Code | CM-AG-FS-1109 |
| Report Type | Market Analysis & Forecast |
| Base Year | 2025 |
| Historical Period | 2021–2025 |
| Forecast Period | 2026–2035 |
| Geographic Scope | GCC |
| Global Coverage | No |
| Regions Covered | Gulf Cooperation Council (GCC) |
| Countries Covered | Saudi Arabia; UAE; Qatar; Oman; Kuwait; Bahrain (6 countries) |
| Market Size Unit | USD Million |
| Volume Unit | Food Production Capacity |
| Report Format | PDF + Excel |
| Page Count | 180–240 |
| Delivery Timeline | 24–48 hours |
| Sample Available | Yes |
| Author / Analyst | Cortex Meridian Agriculture & Food Technology Research Team |
| Publish Date | October 2026 |
| Last Updated | 2026-10-07 |
Market Overview & Definition
Cortex Meridian Research values the Food Security & Food Resilience Market – GCC at USD 6.40 billion in 2025 and forecasts the market to reach USD 14.20 billion by 2035, representing a 2025–2035 CAGR of 8.3%. For this study, the market is defined around paid demand for selective local production, strategic reserves, diversified sourcing, cold chain, aquaculture and resilient supply infrastructure; revenue from adjacent agricultural output is excluded unless it forms part of the stated commercial offering. The demand model follows governments, sovereign investment entities, national food companies, strategic importers and infrastructure operators and separates new installations or capacity additions from replacement, retrofit, software/service and recurring input revenue. The market boundary is particularly important because published estimates often diverge when hardware, services, production value or infrastructure are combined differently. Cortex Meridian applies one consistent revenue boundary across 2021–2035 and evaluates the GCC opportunity against the operating variable that matters most to buyers: security of supply and avoided disruption weighed against the structural cost disadvantage of local production. The model also explicitly tests pursuing self-sufficiency in water- or feed-intensive categories where domestic economics remain structurally weak so the forecast does not overstate adoption where technical availability is ahead of commercial readiness.
Report Description
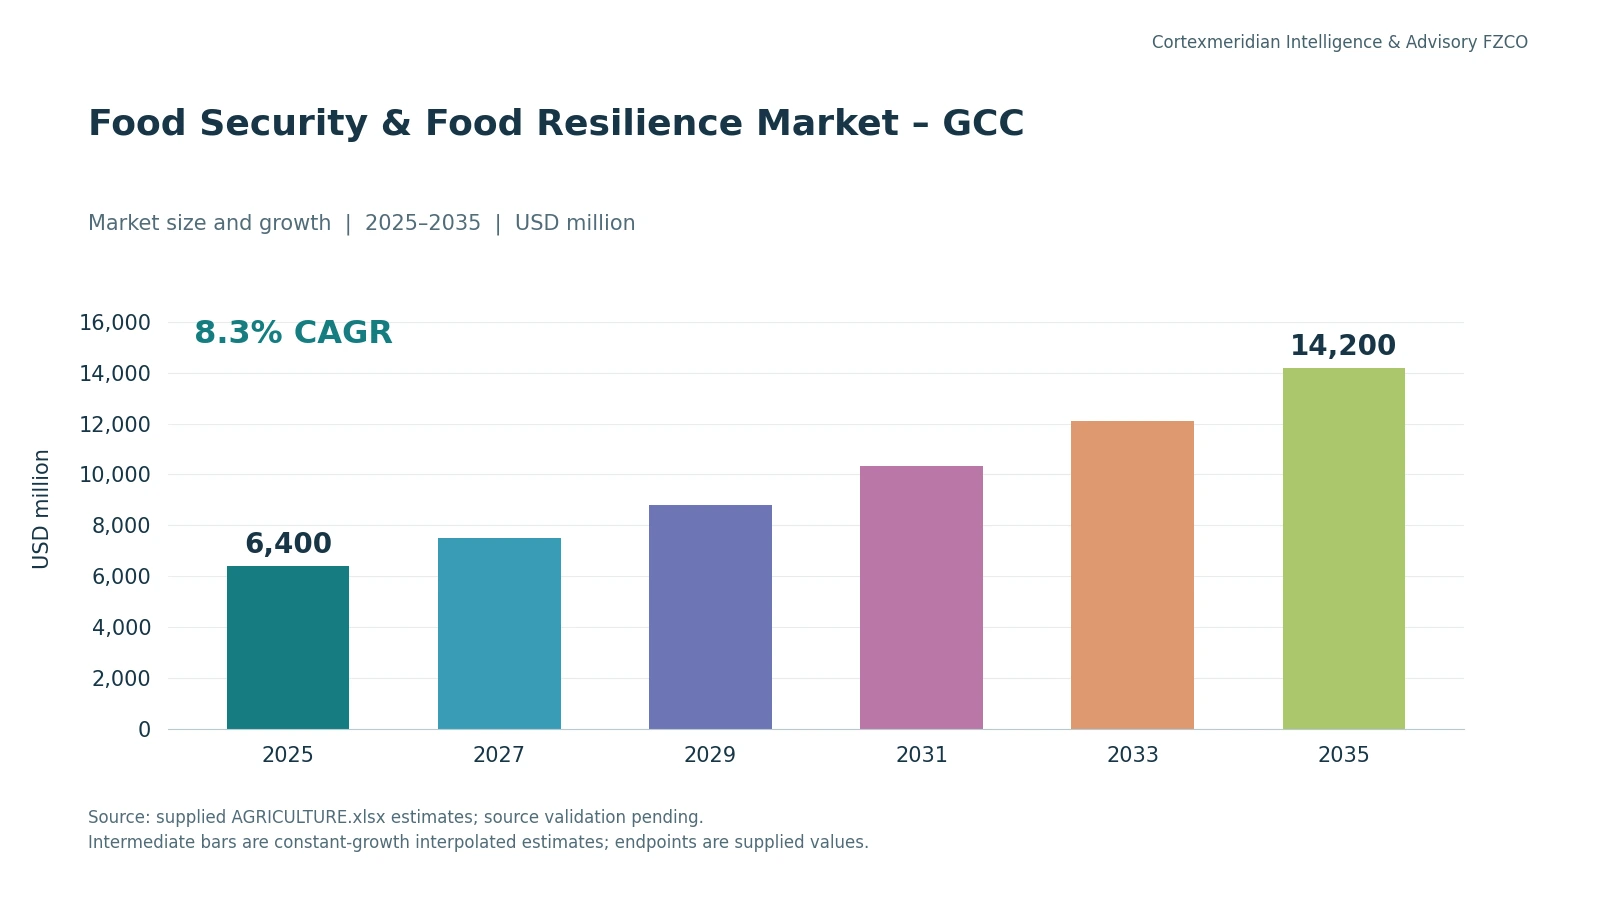
Cortex Meridian Research values the Food Security & Food Resilience Market – GCC at USD 6.40 billion in 2025 and forecasts the market to reach USD 14.20 billion by 2035, representing a 2025–2035 CAGR of 8.3%. The commercial structure of this market is centered on selective local production, strategic reserves, diversified sourcing, cold chain, aquaculture and resilient supply infrastructure. Demand is generated primarily by governments, sovereign investment entities, national food companies, strategic importers and infrastructure operators, and purchasing decisions are increasingly tied to security of supply and avoided disruption weighed against the structural cost disadvantage of local production rather than to technology adoption for its own sake. A major constraint on scalable adoption is pursuing self-sufficiency in water- or feed-intensive categories where domestic economics remain structurally weak. This changes the basis of competition: the relevant ecosystem spans producers, traders, logistics providers, strategic investors and technology firms rather than conventional farm suppliers alone. Technology development is moving toward CEA, aquaculture, traceability, demand forecasting, strategic stock management and technology-enabled local production, which is shifting value from one-time equipment or product sales toward integrated systems, software, services, maintenance and recurring input revenue where applicable. In the GCC market context, Saudi Arabia and the UAE increasingly use a portfolio approach: localize strategic/perishable categories while diversifying imports and overseas assets. The report therefore evaluates not only market growth, but also the quality of that growth—where customers can demonstrate payback, which segments have repeatable operating economics, which countries have executable project pipelines, and where suppliers can create a defensible position through local integration, service, data or channel access.
Overall Market Dynamics
Demand Formation
Demand originates mainly from governments, sovereign investment entities, national food companies, strategic importers and infrastructure operators. Purchase timing is driven by the ability to improve security of supply and avoided disruption weighed against the structural cost disadvantage of local production and by the availability of bankable local references.
Technology Shift
The market is moving toward CEA, aquaculture, traceability, demand forecasting, strategic stock management and technology-enabled local production. This changes the competitive basis from selling a stand-alone product toward integrating technology into the customer's operating workflow.
Adoption Friction
The largest practical constraint is pursuing self-sufficiency in water- or feed-intensive categories where domestic economics remain structurally weak. The forecast therefore discounts deployments where the business case depends on ideal operating conditions or weakly supported pilot assumptions.
Competitive Implication
The relevant ecosystem spans producers, traders, logistics providers, strategic investors and technology firms rather than conventional farm suppliers alone. Suppliers with local service, data integration and application know-how are better positioned to retain customers after the initial sale.
Geographic Implication
Saudi Arabia and the UAE increasingly use a portfolio approach: localize strategic/perishable categories while diversifying imports and overseas assets.
Segmentation & Scope
Segmentation will be tailored to Food Security & Food Resilience Market – GCC and organized across: technology/product type; system architecture; offering (hardware, software, services, consumables where relevant); farm/production scale; application/crop/species; deployment model; customer type; sales channel; and geography. For Food Resilience/GCC Food Systems, the RD will explicitly separate mature revenue pools from emerging technologies, installed-base/retrofit demand from greenfield projects, and one-time equipment sales from recurring service/software/input revenue.
Regional & Country Outlook
GCC outlook: country attractiveness is assessed against the actual operating variables that matter for Food Security & Food Resilience Market – GCC: customer concentration, project pipeline, input/resource economics, infrastructure, policy support, channel depth and serviceability. The regional lens is not a generic country ranking. It tests where security of supply and avoided disruption weighed against the structural cost disadvantage of local production are most favorable and where pursuing self-sufficiency in water- or feed-intensive categories where domestic economics remain structurally weak is least restrictive. For Middle East/GCC markets, Saudi Arabia and the UAE are examined for active projects, buyer organizations, procurement structure and local integration capability; other covered countries are assessed where their production base or technology ecosystem is material. For global titles, North America, Europe, Asia-Pacific, Latin America and Middle East & Africa are compared on adoption maturity, unit economics and supplier concentration.
Competitive Landscape & Companies Covered
The competitive landscape is organized around the ability to deliver selective local production, strategic reserves, diversified sourcing, cold chain, aquaculture and resilient supply infrastructure with demonstrable operating results. The relevant ecosystem spans producers, traders, logistics providers, strategic investors and technology firms rather than conventional farm suppliers alone. Company benchmarking therefore covers product breadth, installed base/reference projects, integration capability, recurring revenue mix, channel model, local service footprint and evidence of customer-level performance. Emerging companies are screened specifically for CEA, aquaculture, traceability, demand forecasting, strategic stock management and technology-enabled local production, while incumbents are assessed for whether they are building these capabilities internally, through partnerships or through acquisition.
Pricing & Ecosystem
Pricing, Cost & Revenue Intelligence
Pricing is assessed against the unit that the buyer ultimately manages economically. For this market, the relevant value case is security of supply and avoided disruption weighed against the structural cost disadvantage of local production. The report distinguishes upfront equipment/project pricing from software subscriptions, consumables, service, maintenance and performance-linked revenue where applicable. Cost analysis tests the variables that can overturn the purchase case—especially those embedded in pursuing self-sufficiency in water- or feed-intensive categories where domestic economics remain structurally weak. Where regional operating conditions materially alter payback, the report presents separate sensitivity logic rather than applying a single global ASP or ROI assumption.
Value Chain & Ecosystem Analysis
The ecosystem starts with the suppliers of the core technologies and inputs behind selective local production, strategic reserves, diversified sourcing, cold chain, aquaculture and resilient supply infrastructure, then follows integrators/distributors into governments, sovereign investment entities, national food companies, strategic importers and infrastructure operators. The analysis identifies who specifies the solution, who signs the purchase order, who services the installed base and who controls the recurring customer relationship. Particular attention is given to the point where technical performance becomes commercial value through security of supply and avoided disruption weighed against the structural cost disadvantage of local production. Bottlenecks such as pursuing self-sufficiency in water- or feed-intensive categories where domestic economics remain structurally weak are mapped to the ecosystem participant best placed to solve them, revealing partnership and margin-pool opportunities.
Opportunity & White-Space Analysis
White-space is defined as an unmet commercial need rather than a high-growth segment alone. The strongest opportunities are where CEA, aquaculture, traceability, demand forecasting, strategic stock management and technology-enabled local production can materially improve security of supply and avoided disruption weighed against the structural cost disadvantage of local production and where existing suppliers have not fully solved pursuing self-sufficiency in water- or feed-intensive categories where domestic economics remain structurally weak. The report ranks opportunities by buyer urgency, technical readiness, addressable account base, channel accessibility, local service requirement and recurring-revenue potential. For GCC markets, the analysis also tests whether localization, integration or operating support can create a defensible position even when the core hardware is globally available.
Executive Summary
Food Security & Food Resilience Market – GCC — Executive Summary
Cortex Meridian Research values the Food Security & Food Resilience Market – GCC at USD 6.40 billion in 2025 and forecasts the market to reach USD 14.20 billion by 2035, representing a 2025–2035 CAGR of 8.3%. The market is not expanding uniformly across every product, technology or customer group. The most commercially attractive revenue pools are concentrated around selective local production, strategic reserves, diversified sourcing, cold chain, aquaculture and resilient supply infrastructure, particularly where buyers can translate investment into security of supply and avoided disruption weighed against the structural cost disadvantage of local production. The principal scaling risk remains pursuing self-sufficiency in water- or feed-intensive categories where domestic economics remain structurally weak; consequently, Cortex Meridian's forecast gives greater weight to deployments with demonstrated operating performance, repeat demand and credible after-sales support than to pilot announcements or theoretical capacity. Competitive positioning is also evolving because the relevant ecosystem spans producers, traders, logistics providers, strategic investors and technology firms rather than conventional farm suppliers alone. Over the forecast period, CEA, aquaculture, traceability, demand forecasting, strategic stock management and technology-enabled local production are expected to reshape product architecture, service models and supplier differentiation. For GCC strategy, Saudi Arabia and the UAE increasingly use a portfolio approach: localize strategic/perishable categories while diversifying imports and overseas assets. The strategic implication is that CAGR alone does not identify the best opportunity. Suppliers and investors should prioritize use cases with measurable customer economics, durable recurring revenue, proven local performance and a clear route to procurement and service. The report therefore combines the market forecast with buyer mapping, country-level opportunity analysis, pricing and ROI intelligence, project pipelines, competitive benchmarking, emerging-player tracking and white-space assessment.
Key Takeaways
Cortex Meridian 2026 market benchmark — 2025 value: USD 6.40 billion; 2035 forecast: USD 14.20 billion; CAGR: 8.3%. Primary buyers: governments, sovereign investment entities, national food companies, strategic importers and infrastructure operators. Core value pool: selective local production, strategic reserves, diversified sourcing, cold chain, aquaculture and resilient supply infrastructure. Commercial KPI: security of supply and avoided disruption weighed against the structural cost disadvantage of local production. Key adoption constraint: pursuing self-sufficiency in water- or feed-intensive categories where domestic economics remain structurally weak. Technology watch: CEA, aquaculture, traceability, demand forecasting, strategic stock management and technology-enabled local production.
Table of Contents
List of Tables
Table: Food Security & Food Resilience market size and forecast, 2021–2035 | Table: segmentation by technology/product | Table: Saudi Arabia market and project pipeline | Table: UAE market and project pipeline | Table: GCC country comparison | Table: global benchmark country comparison | Table: leading companies and offerings | Table: emerging companies/startups | Table: pricing / CAPEX / operating economics | Table: partnerships, launches and investment activity | Table: buyer groups and procurement routes | Table: white-space opportunity scoring
List of Figures
Figure: Food Security & Food Resilience market growth, 2021–2035 | Figure: market segmentation | Figure: technology maturity curve | Figure: GCC opportunity heatmap | Figure: value chain / ecosystem | Figure: competitive positioning | Figure: project/investment map | Figure: customer decision journey | Figure: pricing / ROI sensitivity | Figure: opportunity matrix
Research Methodology
Methodology
Food Security & Food Resilience Market – GCC-specific methodology combines top-down reconciliation with bottom-up modeling. Demand is built from the most relevant physical denominator (Food Production Capacity), installed base or production capacity; technology penetration; replacement/expansion cycles; project pipeline; utilization; and pricing/revenue assumptions. Primary interviews with suppliers, distributors, integrators, farms/producers, buyers and industry experts are used to validate adoption, pricing, procurement and project timing. Country totals are triangulated against trade/production statistics, company disclosures, project announcements, government programs and industry databases. Scenario analysis separates base, upside and downside cases for 2026–2035.
Data Sources & Validation
Validation hierarchy for Food Security & Food Resilience Market – GCC: official agriculture/food-security and statistical agencies; FAO and World Bank datasets; national ministries and GCC food-security programs; company annual reports, investor presentations, product literature and project announcements; industry associations; peer-reviewed technical literature; trade data; procurement/tender material; Growtech exhibitor/speaker intelligence; and structured expert interviews. Event source: https://www.growtechevents.com/ . All market-size, forecast and CAGR values remain marked for validation until the bottom-up model and source reconciliation are completed.
FAQ — Buyer Questions
Q: What will the report quantify? A: 2025 market baseline, 2026–2035 forecast, segmentation and country opportunity for Food Security & Food Resilience. Q: Which GCC markets receive the deepest coverage? A: Saudi Arabia and UAE, followed by Qatar, Oman, Kuwait and Bahrain. Q: Will it identify customers and partners? A: Yes—buyer groups, priority accounts, distributors/integrators and partnership white spaces are part of the scope. Q: Are project and investment pipelines included? A: Yes, where publicly verifiable. Q: Are the market numbers final at RD stage? A: No. Sizing fields are explicitly validated through the research model before publication.
Customization Options
Research synthesis uses regional government and statistical sources, company disclosures, project and tender announcements, industry associations, trade and production data, and multiple published market estimates. The market boundary covers commercial technologies and systems directly enabling local food resilience, including CEA, precision irrigation, aquaculture, food-system digitalization and resilience infrastructure; it excludes the total value of food consumption. Published figures are normalized to a common geographic and revenue boundary before triangulation. Growtech relevance is cross-checked against event sector coverage and exhibitor themes: https://www.growtechevents.com/ .
Need something this report does not cover?
Describe the decision you are facing. If a published study already answers it we will point you there; if not, we will scope the work and come back with timeline and cost.
CM-AG-0009 · CM-AG-FS-1109 · 180–240 pages · Published October 2026 · Cortex Meridian Agriculture & Food Technology Research Team