
- Home
- Reports Store
- Medical Devices
Medical Imaging Systems Market
Customise your request
Need this report to answer something it does not cover? Tell us the decision you are facing and we will scope the work — or point you to a study that already answers it.
info@cortexmeridian.com+971 56 483 5090Report Scope
| Report ID / SKU | CM-MD-0009 |
|---|---|
| Report Code | CM-MD-P1-1009 |
| Report Type | Market Analysis & Forecast |
| Base Year | 2025 |
| Historical Period | 2021–2025 |
| Forecast Period | 2026–2035 |
| Geographic Scope | Global |
| Global Coverage | Yes |
| Regions Covered | North America; Europe; Asia-Pacific; Latin America; Middle East & Africa |
| Countries Covered | US; Canada; Mexico; UK; Germany; France; Italy; Spain; Netherlands; Switzerland; China; India; Japan; South Korea; Australia; Brazil; Argentina; Saudi Arabia; UAE; South Africa (20 countries) |
| Market Size Unit | USD Billion |
| Volume Unit | Systems / Installed Base / Procedures |
| Report Format | PPT / WORD / EXCEL / PDF |
| Page Count | 180-220 |
| Delivery Timeline | 48 hours |
| Sample Available | Yes |
| Author / Analyst | Cortex Meridian Medical Devices Analyst Team |
| Publish Date | October 2026 |
| Last Updated | 2026-10-06 |
Market Overview & Definition
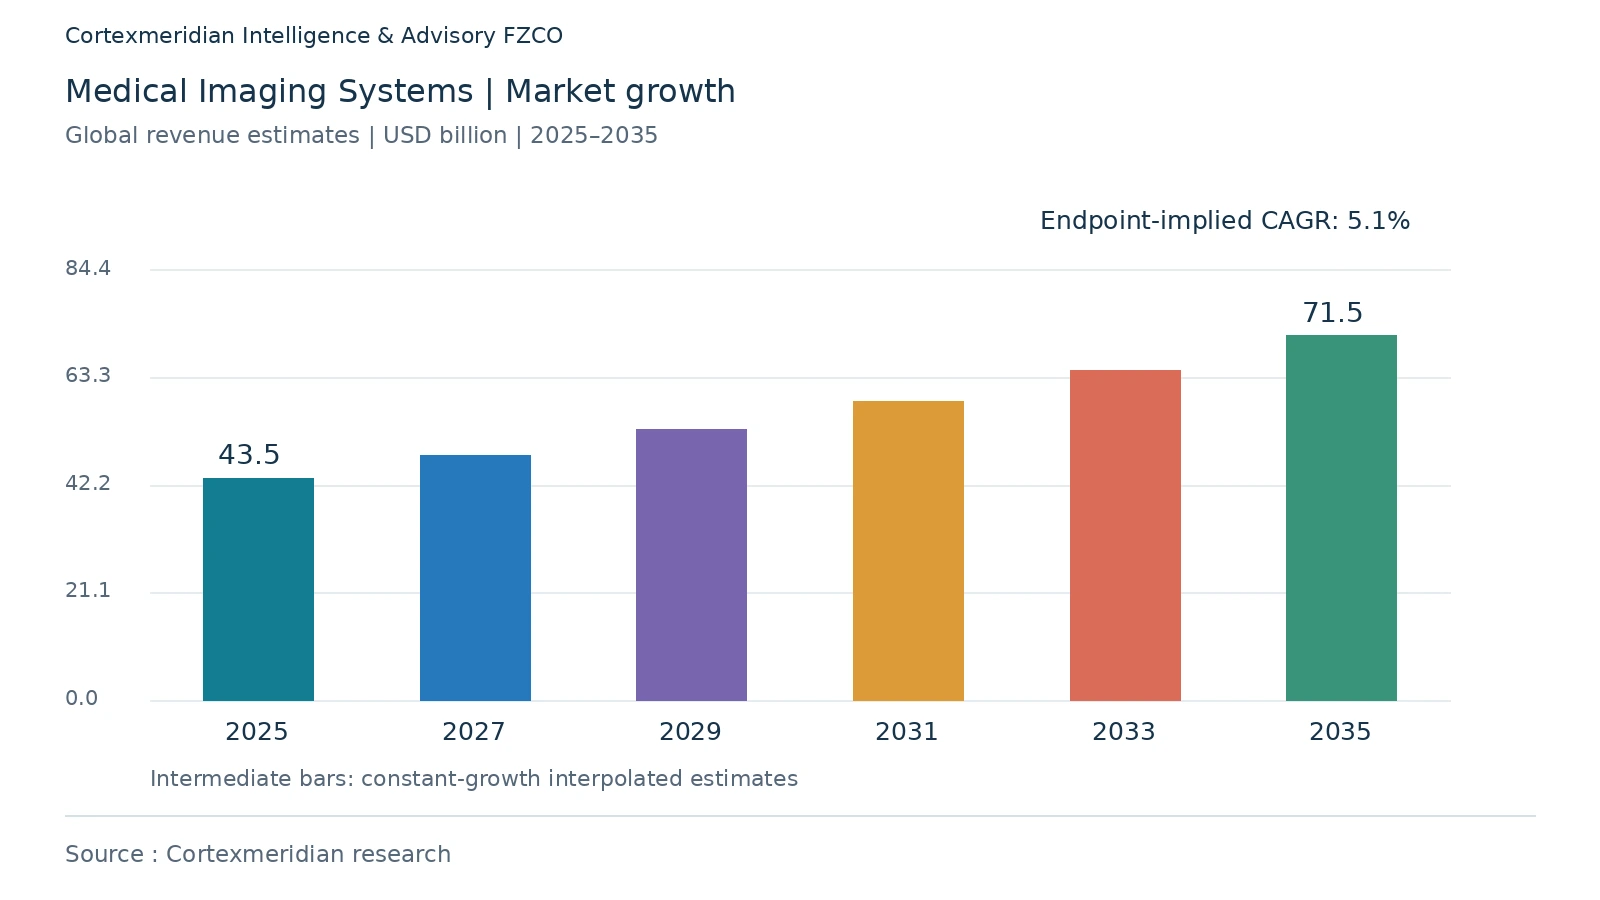
The global Medical Imaging Systems market is estimated by Cortex Meridian Research at USD 43.5 billion in 2025 and is projected to reach approximately USD 71.5 billion by 2035, implying a CAGR of 5.1%. Unlike many device markets, imaging growth is constrained by long capital replacement cycles, so market expansion depends heavily on technology upgrades and software monetization rather than unit growth alone. Hospitals replace scanners when new systems can materially improve throughput, dose efficiency, image quality, workflow or service economics.
The strongest value shift is toward software-rich platforms. Photon-counting CT, AI reconstruction, low-helium MRI, portable ultrasound and cloud enterprise imaging are increasing the economic value of installed systems. This allows OEMs to generate recurring revenue through software subscriptions, service contracts and enterprise workflow products rather than depending only on capital-equipment cycles.
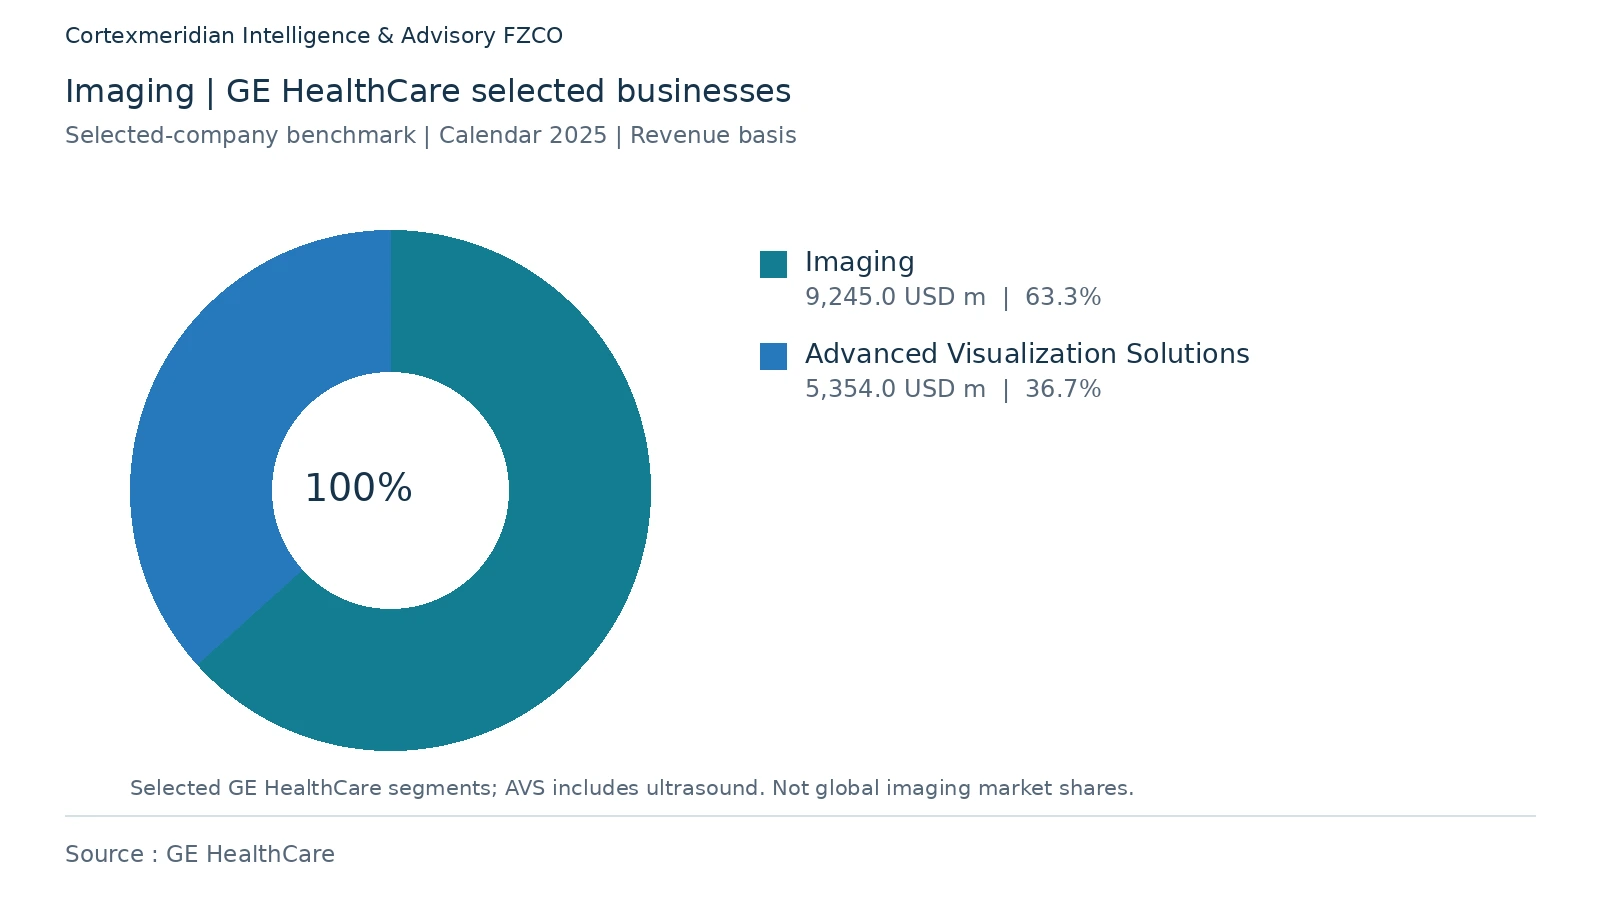
GE HealthCare’s USD 2.3 billion Intelerad acquisition is especially important because it moves the company deeper into cloud PACS and enterprise imaging. Its announced Sofie Biosciences transaction further strengthens molecular-imaging capabilities, while the NVIDIA collaboration pushes AI into autonomous imaging workflows. Siemens Healthineers, Philips and Canon Medical are pursuing similar strategies around AI, workflow and platform integration. The competitive center of gravity is therefore moving from modality hardware toward connected imaging ecosystems.
Report Description
The Medical Imaging Systems Market covers revenue generated from the defined medical-device products, related consumables and software/services where directly attached to the device workflow. The report excludes unrelated pharmaceuticals and stand-alone healthcare services. The scope is designed for manufacturers, suppliers, distributors, hospitals, diagnostic providers, investors and strategy teams evaluating demand, technology shifts, pricing and competitive opportunity.
Overall Market Dynamics
Drivers
Chronic disease burden, early diagnosis, aging populations, replacement cycles, imaging-center expansion and AI integration.
Restraints / Risks
High capital cost, long replacement cycles, reimbursement pressure, radiologist shortages and service/maintenance burden.
Opportunities
Photon-counting CT, portable/handheld ultrasound, low-field MRI, AI workflow tools, cloud imaging and emerging-market infrastructure.
Strategic themes
AI/connectivity, workflow efficiency, reimbursement, regulatory approvals, recurring consumables/service revenue, and regional access expansion.
Segmentation & Scope
By technology: X-ray, CT, ultrasound, MRI, nuclear imaging; by design: fixed, mobile, portable/handheld; by application: cardiology, oncology, neurology, orthopedics, gastroenterology, women’s health; by end use and geography.
Regional & Country Outlook
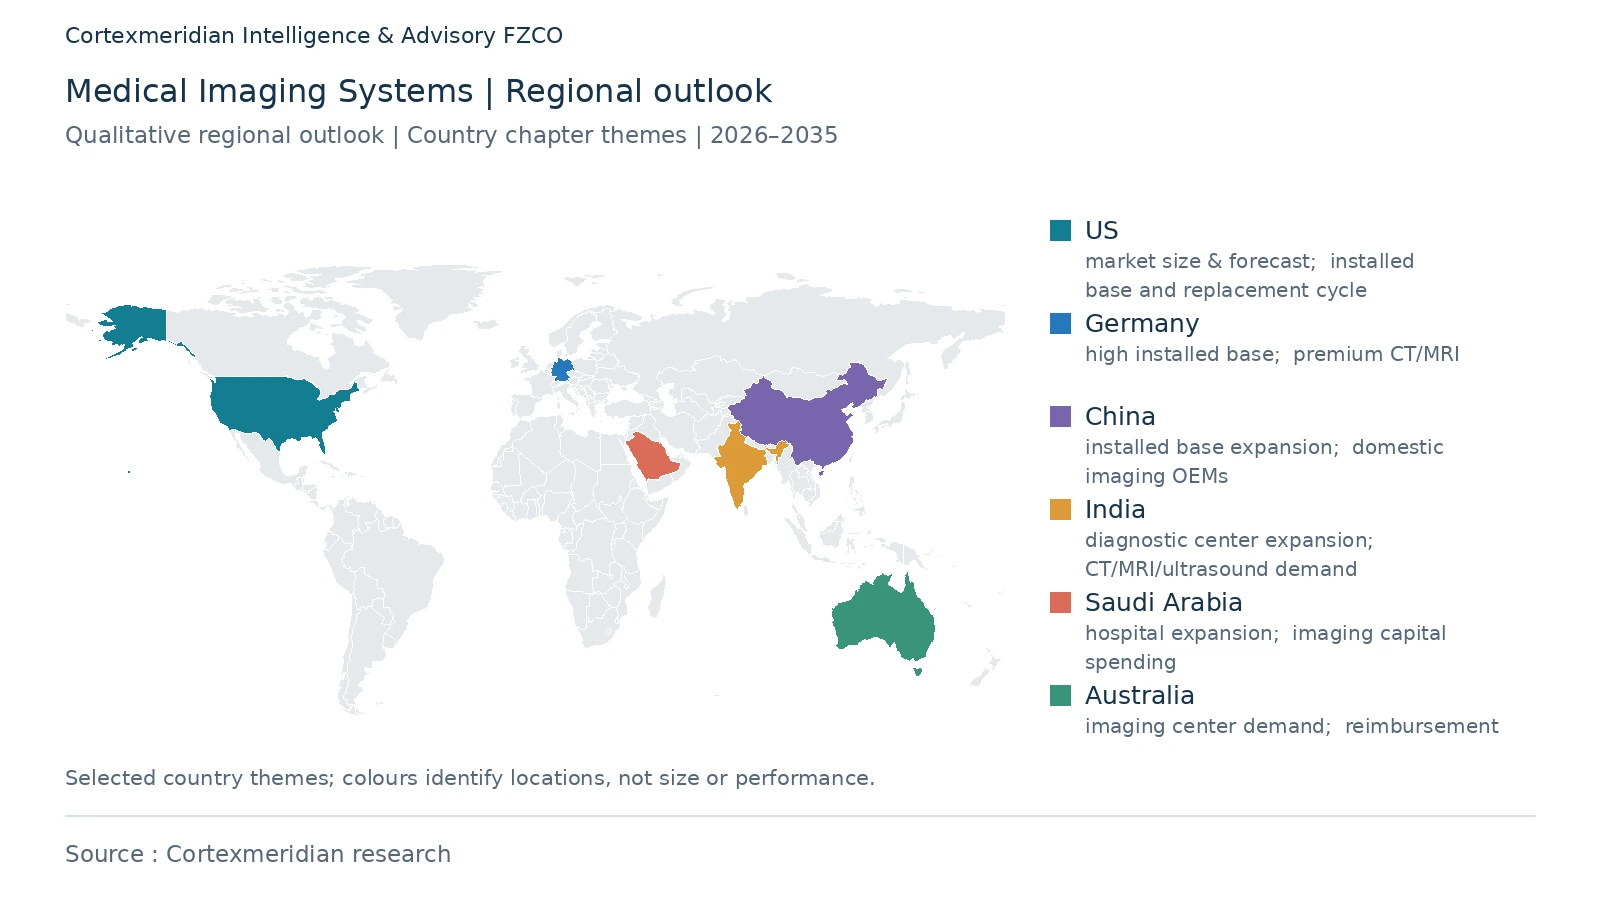
COUNTRY CHAPTER COVERAGE 1. US: market size & forecast; installed base and replacement cycle; CT/MRI/ultrasound/X-ray mix; reimbursement; AI/cloud adoption; GE/Siemens/Philips/Canon competition. 2. Canada: installed base; provincial capital budgets; imaging wait times; MRI/CT expansion; cloud imaging; procurement. 3. UK: NHS imaging capacity; scanner replacement; diagnostic backlogs; community diagnostics; AI adoption; procurement. 4. Germany: high installed base; premium CT/MRI; replacement cycles; reimbursement; hospital digitization. 5. France: hospital imaging investment; CT/MRI/ultrasound; reimbursement; teleradiology; procurement. 6. Italy: regional imaging infrastructure; replacement demand; CT/MRI; public/private mix. 7. Spain: public hospital imaging; replacement cycle; CT/MRI/ultrasound; procurement. 8. Netherlands: enterprise imaging; cloud PACS; advanced MRI/CT; AI workflow; teleradiology. 9. Switzerland: premium imaging systems; private/public hospitals; MRI/CT; AI-enabled workflows. 10. China: installed base expansion; domestic imaging OEMs; localization; CT/MRI demand; procurement/pricing. 11. India: diagnostic center expansion; CT/MRI/ultrasound demand; price tiers; local manufacturing; private chains. 12. Japan: aging-driven imaging demand; CT/MRI density; reimbursement; domestic OEMs; replacement cycle. 13. South Korea: advanced imaging; high CT/MRI utilization; AI imaging; hospital digitization. 14. Australia: imaging center demand; reimbursement; remote radiology; CT/MRI/ultrasound replacement. 15. Brazil: private imaging chains; public access; import pricing; CT/MRI/ultrasound; distributor market. 16. Argentina: imaging installed base; import dependency; pricing; private hospital demand. 17. Saudi Arabia: hospital expansion; imaging capital spending; localization; AI/cloud adoption; tenders. 18. UAE: premium imaging centers; private hospitals; advanced MRI/CT; AI and cloud adoption. 19. South Africa: public/private imaging gap; CT/MRI access; replacement needs; distributor structure.
Competitive Landscape & Companies Covered
GE HealthCare; Siemens Healthineers; Philips; Canon Medical; Fujifilm; Samsung Medison; Mindray; Hologic; Esaote; Konica Minolta; Carestream
Pricing & Ecosystem
Pricing, Cost & Revenue Intelligence
Pricing intelligence benchmarks capital-system ASPs, disposable/consumable pricing, procedure-linked device pricing, service contracts, software subscriptions and regional tender dynamics where applicable. The model distinguishes capital equipment from recurring revenue and evaluates discounting, bundling, distributor margins, reimbursement sensitivity and premium technology price realization.
Value Chain & Ecosystem Analysis
The ecosystem maps component and sensor suppliers, materials vendors, device OEMs, software/AI partners, contract manufacturers, sterilization and packaging providers, distributors, hospitals/diagnostic laboratories/ASCs, clinicians, payers and regulators. The analysis identifies control points in the value chain, recurring-revenue pools, channel dependencies and partnership opportunities.
Opportunity & White-Space Analysis
A weighted opportunity model scores product segments, technologies, countries, end users and accounts using growth, market size, clinical adoption, reimbursement, competitive intensity, regulatory accessibility and margin potential. Priority white spaces include Photon-counting CT, portable/handheld ultrasound, low-field MRI, AI workflow tools, cloud imaging and emerging-market infrastructure.
Executive Summary
Cortex Meridian Research estimates the Medical Imaging Systems market at USD 43.5 billion in 2025, rising to approximately USD 71.5 billion by 2035 at a CAGR of 5.1%. Because scanner replacement cycles are long, growth depends less on unit expansion and more on higher-value technology, software, service and workflow integration.
GE HealthCare’s Intelerad acquisition is strategically significant because it adds cloud PACS and recurring enterprise-imaging revenue to a traditional modality business. Its Sofie Biosciences deal and NVIDIA collaboration further show how imaging companies are extending beyond hardware into molecular imaging, AI and software-enabled workflows. This shift is likely to support growth and improve revenue quality even when capital-equipment demand is uneven.
Key Takeaways
- 2025 Cortex normalized estimate: USD 43.5 billion
- 2035 normalized outlook: USD 71.5 billion
- Normalized 2025–2035 CAGR: 5.1%
- Key growth drivers: Chronic disease burden, early diagnosis, aging populations, replacement cycles, imaging-center expansion and AI integration.
- Priority opportunity areas: Photon-counting CT, portable/handheld ultrasound, low-field MRI, AI workflow tools, cloud imaging and emerging-market infrastructure.
- Primary competitive set: GE HealthCare; Siemens Healthineers; Philips; Canon Medical; Fujifilm; Samsung Medison; Mindray; Hologic; Esaote; Konica Minolta; Carestream
Table of Contents
List of Tables
- Global market value, 2021–2035
- Market by product/device type
- Market by technology
- Market by application/procedure
- Market by end user
- Market by region
- Country market sizing
- Installed base/procedure/test indicators
- ASP/pricing benchmark
- Company/product benchmark
- Opportunity attractiveness scoring
List of Figures
- Market size and CAGR outlook
- Segment attractiveness matrix
- Technology adoption curve
- Regional opportunity heat map
- Competitive positioning matrix
- Value-chain ecosystem map
- Pricing/revenue model
- Opportunity prioritization matrix
Research Methodology
Methodology
Cortex Meridian Research applies a triangulated market-sizing framework combining company disclosures, regulatory databases, procedure/test volumes, installed-base indicators, shipment and utilization data, hospital and laboratory purchasing patterns, reimbursement signals, product approvals, and primary research. Public market benchmarks are used only as external calibration points; Cortex values are normalized to the defined scope and forecast period. Forecasts consider technology adoption, procedure/test growth, replacement cycles, pricing, reimbursement, regulatory changes, and regional healthcare investment.
Data Sources & Validation
Company annual reports and investor materials; FDA, EMA and other regulatory databases; WHO and national health agencies; peer-reviewed clinical literature; procurement and reimbursement sources; hospital/laboratory statistics; trade and shipment indicators; company product portfolios; primary interviews; and public market benchmarks used for calibration.
FAQ — Buyer Questions
Q: What is the 2025 global Medical Imaging Systems market size? A: Cortex Meridian Research estimates it at approximately USD 43.5 billion.
Q: What is the 2035 market outlook? A: The normalized outlook is approximately USD 71.5 billion, based on a 5.1% CAGR assumption.
Q: What are the major growth drivers? A: Chronic disease burden, early diagnosis, aging populations, replacement cycles, imaging-center expansion and AI integration.
Q: Which opportunities should suppliers prioritize? A: Photon-counting CT, portable/handheld ultrasound, low-field MRI, AI workflow tools, cloud imaging and emerging-market infrastructure.
Customization Options
Customization can include country-level sizing, procedure/test volumes, installed base, ASP benchmarking, hospital/lab account mapping, competitor benchmarking, product pipeline analysis, regulatory and reimbursement tracking, KOL mapping, distributor/channel assessment, and opportunity prioritization.
Need something this report does not cover?
Describe the decision you are facing. If a published study already answers it we will point you there; if not, we will scope the work and come back with timeline and cost.
CM-MD-0009 · CM-MD-P1-1009 · 180-220 pages · Published October 2026 · Cortex Meridian Medical Devices Analyst Team